Load-pull characterization is an essential tool to increase the efficiency of power amplifiers. Time and cost historically have forced vendors to perform load-pull during design, but now the speed, size, and synchronization capabilities are improving measurement times. New hardware and software tools are also making it possible to verify power amplifier performance during production testing.

At the recent International Microwave Symposium, National Instruments announced that it would conduct joint development of load-pull solutions with Anteverta Microwave, Focus Microwaves, Maury Microwave, and Mesuro. These vendors are combining their expertise with NI PXI hardware and LabVIEW system design software to overcome the increasingly difficult source and load-pull characterization requirements placed on microwave power amplifiers for aerospace and defense and wireless infrastructure applications.
Load-pull example application
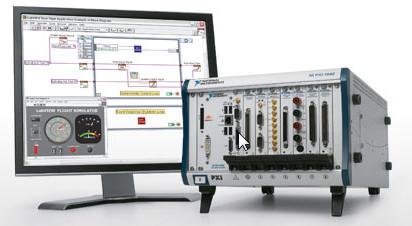
A LabVIEW example illustrates the process of performing a CW load-pull sweep using a Maury LXI tuner for a given frequency and available power at the DUT input port to retrieve load-pull results. To capture delivered output power and transducer gain, the system uses a NI PXIe-5644R VST as a CW signal generator and frequency-selective power meter.
When the DUT is in the fixture, one can specify the S-parameters of the path between the fixture ports and the DUT pins at the input and output side, respectively. For power application, a pre-amplifier can be included in the setup, and some nominal amplifier values should be specified in the application to avoid overdriving the amplifier and/or the DUT.
To stay away from the 1W (30dBm) maximum handling power of the VST RF input, proper attenuation might be required, and the corresponding S-parameters are specified as part of the Back Port block.
When the setup is configured, the user must perform an input power calibration to determine the required VST source power for a desired available power at the DUT input port.
Application results
When the load-pull sweep is completed, users can analyze the results in the load Smith plot. The measured quantity (Pdelout or Gt) is selected to display in the load Smith plot using a dropdown list. A square symbol identifies the load impedance corresponding to the maximum or minimum measured quantity, depending on the selection in the Highlight dropdown list.
By right-clicking in the Smith plot, the user can activate a marker or use zoom tools by selecting Set Marker or Zoom in the menu. When Set Marker is active, one can specify the Marker Mode (None, Free, Snap to Point, or Snap to Min/Max) in the corresponding context menu.
Source: http://www.designnews.com/author.asp?section_id=1386&doc_id=265648&itc=dn_analysis_element&


